Image 1 · Hero
Rig on the rooftop at night, Chicago skyline glowing behind it
If you've spent any time on astrophotography forums, you've seen the debate. Someone asks "how long should my subs be?" and forty replies later there's no answer, just camps. The long-sub camp says more photons per frame, fewer stacking artifacts. The short-sub camp says modern CMOS read noise is so low it doesn't matter, and short subs are easier on your mount and your satellite-streaked sky.
I image from a rooftop in the heart of Chicago. Bortle 9, surrounded by LED streetlights, planes on approach to O'Hare, the stadium lights of Wrigley Field, and a sky that never really gets dark. Every piece of conventional wisdom in this hobby was written for someone with darker skies than mine, so a few weeks ago I decided to stop guessing. I designed an actual experiment to answer this question for my rig, my filter, and my sky, once and for all.
Image 1b
Wrigley Field stadium lights from the rooftop
The answer surprised me. My prediction was wrong, and I'm going to show you exactly how it was wrong, because that's the whole point of doing the experiment.
The backstory: earning the long subs
Part of this hobby, for me, has been squeezing every nuance out of my equipment as I upgrade. Each new piece of gear isn't just a purchase, it's a project: figure out what it can really do, find its limits, push past where I was before.
For a long time, long subs simply weren't on the menu for me. My sub length has been a ladder, and every rung was an upgrade: on my Star Adventurer 2i I lived at 30 to 60 seconds. A sturdier tripod bought me 90. Adding autoguiding got me to 180. Then I upgraded to the ZWO AM3N and was honestly amazed at the quality of 300-second subs coming off it, so I finally decided to test 600 seconds, and it just worked: clean, round-star, ten-minute subs from a rooftop in the middle of a major city.
Image 2
Single 600s sub, screen-stretched, with round-star crop
Image 3
PHD2 guiding graph during a 600s exposure
That felt great. Ten-minute subs are a kind of merit badge. But it immediately raised a question I couldn't shake: now that I can shoot them... should I?
The question, stated properly
Here's the precise version of the question: if I hold total integration time constant, does the length of my individual subs change the signal-to-noise ratio of the final stack?
The "total time constant" part is everything. Of course 3 hours of 600s subs beats 30 minutes of 30s subs. The real question is whether 30 minutes of 600s subs beats 30 minutes of 30s subs. Same photons collected from the target either way. So what changes?
Exactly one thing changes: how many times you read the sensor.
The SNR of a stack looks like this:
            s · T
SNR = ────────────────────────────
      √( (s + b + d) · T  +  N · r² )
When you reslice a fixed T into more or fewer subs, every term stays put except one: N times r squared, the accumulated read noise. Sixty 30-second subs means paying the read-noise toll sixty times. Three 600-second subs means paying it three times.
So the entire debate boils down to one question: is that toll big enough to notice?
- If your sky is bright enough that sky shot noise swamps read noise in every sub, the toll is pocket change. Sub length doesn't matter. This is being sky-limited.
- If your sky is dark (or your filter is narrow enough to make it effectively dark), read noise is a real fraction of each sub's noise, and longer subs genuinely win. This is being read-noise-limited.
The rule of thumb: when the sky background in a single sub reaches roughly 10x the read noise squared, you're thoroughly sky-limited. My camera (ASI2600MC Pro at gain 100) reads at about 1.5 electrons, so read noise squared is just 2.25 electrons. The question is how fast my Chicago sky, filtered through an Optolong L-eXtreme dual-band, piles up sky electrons against that target.
My prediction (written down before I measured anything)
This is the part most people skip, and it's the most important part. Before taking a single frame, I worked out what theory predicted, so I couldn't fool myself afterward.
My reasoning: the L-eXtreme passes two 7nm slices of the spectrum and rejects the rest, including most of Chicago's broadband LED glow. So even under a Bortle 9 sky, I expected to behave like a narrowband imager: a low effective sky rate, meaning partly read-noise-limited, meaning longer subs should win modestly. My pre-registered bet was that 600s subs would beat 30s subs by something like 5 to 15 percent at equal total time.
I also set a decision rule in advance: if the longest-to-shortest SNR ratio came in under 1.03, I'd call it "sub length doesn't matter." Over 1.05 with a rising curve, "sub length matters." No moving the goalposts after the fact.
The experiment
One night, one target (IC 1318, the Butterfly Nebula region around Sadr in Cygnus), six sub lengths: 30, 60, 120, 180, 300, and 600 seconds, each getting exactly 30 minutes of total integration. Every length divides 1800 seconds cleanly, so the comparison is exactly equal-time: 60 subs, 30 subs, 15, 10, 6, and 3.
Image 4
N.I.N.A. Advanced Sequencer showing the interleaved cycles
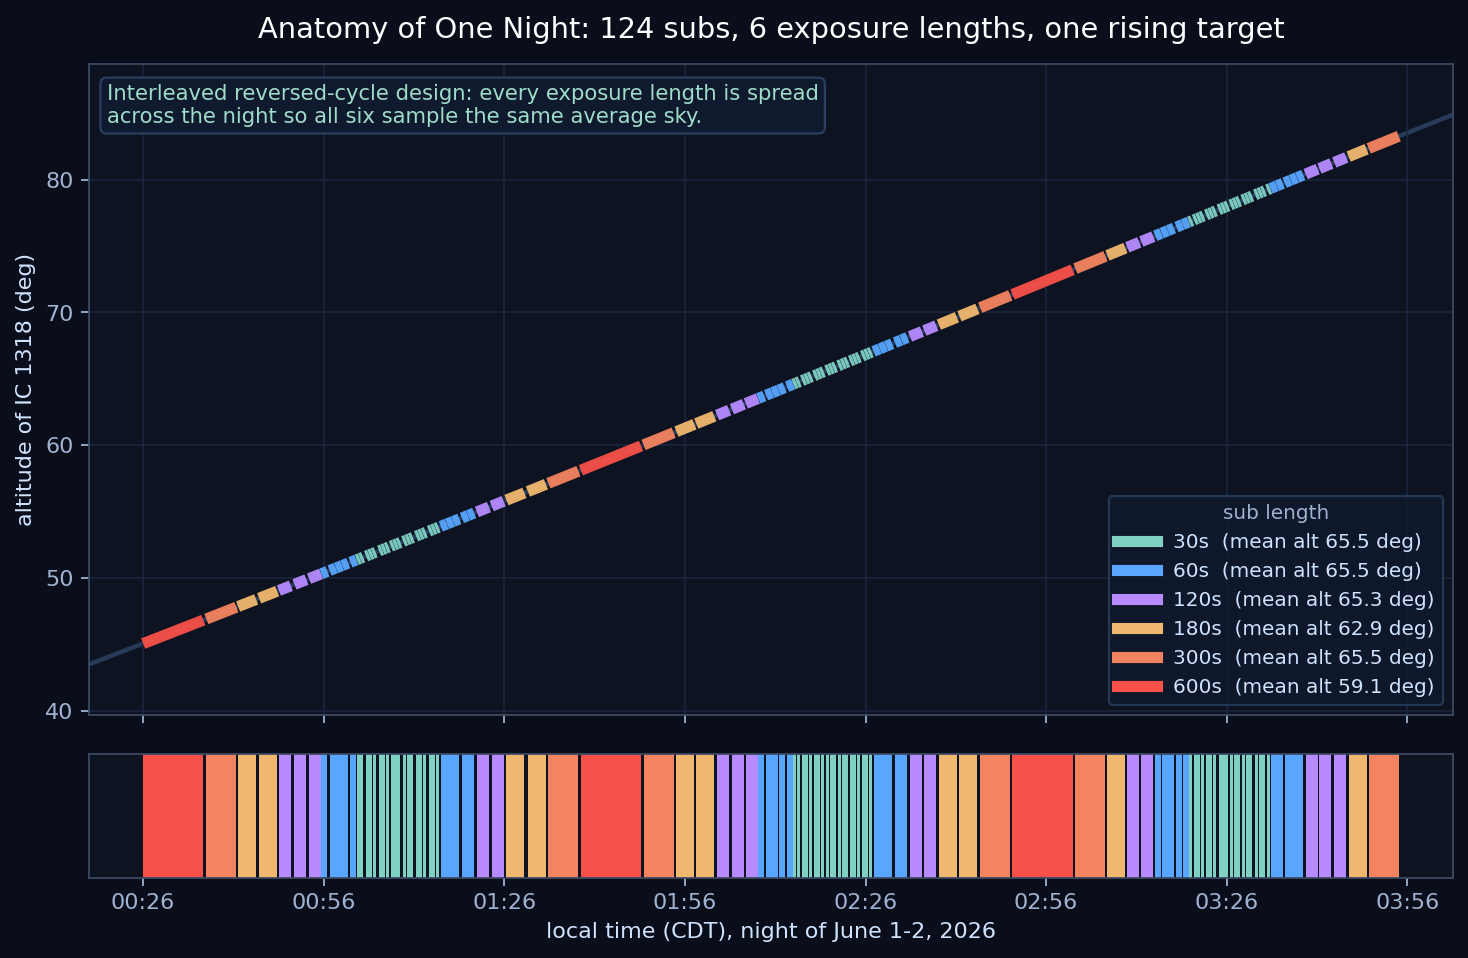
The sneaky-hard part of an experiment like this is the sky itself. Sky brightness and airmass drift all night, so if you shoot all your 30s subs at midnight and all your 600s subs at 4am, you're not measuring sub length, you're measuring the weather. The fix is interleaving: I split the night into six cycles, each containing a mini-block of every sub length, and reversed the order of the lengths every other cycle. Long subs led the odd cycles, short subs led the even ones. That way every sub length experienced the same average sky and the same average altitude. The three 600s frames were spread across the early, middle, and late thirds of the night.
Calibration was matched per length: each stack got its own dark library at the same temperature, gain, and offset, with one shared set of flats and dark-flats across all six. (Foreshadowing: this detail comes back to bite me, in an instructive way.)
Image 5
Six final stacks side by side, identically stretched, 30s to 600s
Measuring it honestly
All six stacks went through identical Siril pipelines and were registered into one sequence, so a selection drawn at one spot samples the same patch of sky in every stack. I measured two regions on each: a patch of uniform nebulosity (the signal) and a patch of blank sky (the background), same pixel coordinates across all six.
SNR is then just (signal mean minus background median) divided by background sigma. No tricks, no plugins, just the statistics dialog and some arithmetic.
Image 6
Siril screenshot with the two measurement selections visible
You cannot compare raw noise numbers between stacks of different sub lengths. The 600s stack sits on roughly 20x more accumulated sky per frame, so its absolute noise is bigger even when its quality is identical. Only the ratio of signal to noise is a fair, exposure-independent comparison.
The results

| Sub length | 30s | 60s | 120s | 180s | 300s | 600s |
|---|---|---|---|---|---|---|
| Stack SNR | 5.95 | 6.21 | 6.82 | 6.63 | 5.56 | 5.84 |
Flat. The mean SNR across all six lengths is 6.17 with about 7 percent scatter, and there is no rising trend. My headline ratio, SNR(600s) over SNR(30s), came in at 0.98. Not only did the ten-minute subs fail to beat the thirty-second subs, they came in a hair under, almost certainly because a stack of 3 frames has nearly no power to reject outliers, while a stack of 60 frames shrugs off satellites and planes like they're nothing.
The cleanest confirmation is a regression trick: in the SNR formula, if read noise matters, then 1/SNR² should rise linearly with 1/t. The fitted slope on my data is -0.003. Indistinguishable from zero. There is no read-noise penalty hiding anywhere in my data.
My prediction was wrong. Working backwards from my own measurements, my sky rate through the L-eXtreme came out to roughly 0.2 to 0.5 electrons per second per pixel. Even my shortest 30-second subs were collecting several times the read-noise-squared in sky electrons. Chicago's sky is so bright that even after a dual-band filter strips most of it away, what's left still swamps 1.5 electrons of read noise almost immediately. I'm sky-limited at 30 seconds. Everything past that is just slicing the same pie differently.
The bonus lesson I didn't plan for
Midway through the analysis I realized my 180s stack had been calibrated with an old set of darks. I reshot them fresh and re-measured: the SNR jumped from 6.27 to 6.63. That's a 6 percent improvement from calibration alone, the same order of magnitude as the entire effect I'd built a whole experiment to detect. If you take one practical lesson from this post, it might honestly be that one: keep your dark library current. Boring calibration discipline is worth as much as your entire exposure strategy.
So what do I actually shoot now?
For broadband-ish targets through the L-eXtreme from my sky: 120 to 180 second subs. The physics says anything from 30 seconds up is a wash, so I'm choosing from the flat part of the curve based on practicality. I'll admit a small bias here: if there's any extra signal to squeeze out at the margins, 180s keeps me covered, and it doesn't hurt that 120s and 180s happened to be my two highest measured points (within the scatter, to be fair, but I'll take the placebo).
And once the physics says SNR is a wash, everything practical argues for the shorter side. This is the part that genuinely changed how I think about it: there isn't just no penalty for shorter subs, there's a real, affirmative case for them.
- Less star bloat. Long exposures don't just saturate bright cores (gain 100 on this camera only has about a 16k-electron well, and the Sadr field is packed with stars that clip badly at 600s), they also give seeing, tiny guiding excursions, and atmospheric dispersion more time to smear every star. Shorter subs keep stars tighter and preserve color in the cores.
- Less wasted data. A passing cloud, a wind gust shaking the rig, a plane on the O'Hare approach, a satellite streak, a bumped cable: each one costs me 2 or 3 minutes instead of 10. With only 3 subs in a 600s stack, one ruined frame is a third of the data. At 120s it's a rounding error.
- Better rejection. Sigma clipping is a statistics game, and statistics need numbers. Per half hour, 120 to 180s gives the stacking algorithm 10 to 15 frames to vote with instead of 3. That's the difference between rejection that actually works and rejection that's just hoping.
- Cheaper mistakes everywhere. A guiding hiccup, a failed dither settle, a meridian flip timed badly: every interruption costs less when the unit of loss is smaller.
The long-sub camp isn't wrong everywhere. Under dark skies or a 3nm filter, the read-noise math can genuinely favor them. But when your sky hands you a flat SNR curve like mine did, the tiebreakers all point the same direction, and it's toward shorter.
Here's the part I find delightful: the ten-minute subs still mattered. Not for SNR, but because chasing them is what forced me to get my guiding, balance, and stability good enough that sub length became a choice instead of a limitation. I pushed the gear until it could do the hard thing, and then the data told me the easy thing was just as good. I'll take that trade every time.
The caveats (because honesty is the whole brand)
This result is mine, not yours. It holds for my Bortle 9 sky, this filter, and a relatively bright emission target. If you image under Bortle 4 skies, or with a 3nm narrowband filter, your sky rate could easily be 10x lower than mine, and you may be genuinely read-noise-limited, where longer subs really do win. The beauty of this method is that you don't have to take anyone's word for it, including mine. One night, six stacks, two measurement boxes in Siril, and you'll know your own answer.
The single most useful number to come out of this is my measured sky rate: about 0.3 electrons per second per pixel through the L-eXtreme. With that one number, I can now compute the optimal sub length for any future filter or target before I ever open the shutter. That's the real prize. Not a rule of thumb from a forum, but the actual limiting factor of my actual sky, measured from my actual roof.
Image 8 · Closer
Finished IC 1318 image
Questions about running this on your own rig? The full experimental protocol, the prediction tables, and the analysis method are things I'm happy to share. Find me on Instagram @m102_astro.